
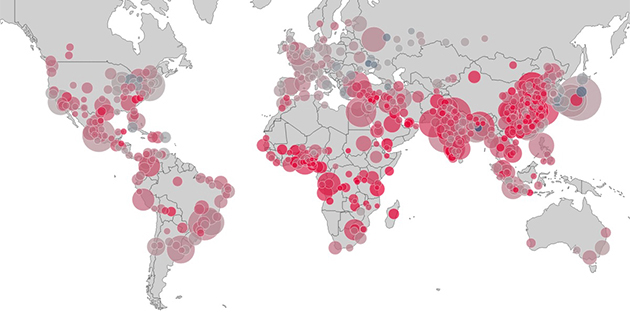
A new interactive data visualization from Mathematica Policy Research traces the world’s increasing urbanization—highlighting its uneven pattern over time and across the globe. The pattern of future city growth is particularly important for climate policies that seek to curb greenhouse gas emissions. Cities with the largest and most rapid growth represent an important opportunity to leverage the investments they make to accommodate their growing populations to also support low carbon development.
The visualization, part of Mathematica’s expanded portfolio of climate and environmental research, shows cities’ population growth from 1950 to 2030. It shows how urbanization is affecting cities around the world and lets viewers explore patterns over time and across continents.
“Because urban areas consume most of the energy in the world, they are part of both the policy problem and the policy solution,” said senior fellow and senior vice president Craig Thornton, who heads up the new area of research at Mathematica. “By targeting those that are growing most rapidly, policy interventions could play a key role in mitigating the rise in greenhouse gases in the future.”
Building on a long history of policy research, coupled with insights into behavioral science and experience with evaluation design, Mathematica is helping to examine the effectiveness of policies and create strategies for responding to climate and environmental issues.
Read more about Mathematica’s work to protect the environment.