
States that received grants under the Race to the Top-Early Learning Challenge (RTT-ELC) initiative made progress in developing systems that rate early childhood education programs on quality and help them improve, according to a new report released by the U.S. Department of Education’s Institute of Education Sciences. However, states differed substantially in the ways that they structured and implemented, promoted participation in, and rated and monitored programs in these systems. Through $520 million in the first of three rounds of grants, RTT-ELC aimed to improve young children’s access to high quality early childhood education. This is the first report from a multiyear evaluation of RTT-ELC conducted by Mathematica Policy Research.
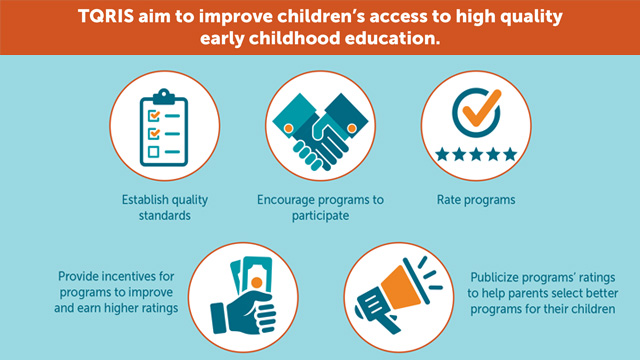
RTT-ELC awards helped states develop and implement systems, known as tiered quality rating and improvement systems (TQRIS), that aim to improve the quality of early childhood education programs and help parents select better programs for their children. These systems establish rigorous standards to define quality, rate programs based on these standards, and publicize the ratings of individual programs. States use supports and incentives to encourage programs to participate in TQRIS and earn higher ratings.
Nine states received Round 1 RTT-ELC grants: California, Delaware, Maryland, Massachusetts, Minnesota, North Carolina, Ohio, Rhode Island, and Washington. They were expected to make progress in five areas related to TQRIS:
- Developing and adopting a common statewide TQRIS
- Promoting participation in TQRIS
- Rating and monitoring programs
- Promoting access to high quality programs for high-needs children
- Validating the effectiveness of the TQRIS
The new report describes the progress these states made as of 2015 in the first three areas, noting the following:
- Eight of the nine states had a statewide TQRIS in place by 2015. Only four of the nine states had a statewide TQRIS in place in 2010, before the grant award.
- States promoted participation in TQRIS in several ways. Six of the nine states made it mandatory for certain programs, such as public prekindergarten or Head Start programs, to participate. States provided alternative pathways into higher rating levels to ease the burden of data collection and verification processes on programs that already met high external quality standards. States offered financial incentives tied to higher ratings.
- States used different methods to calculate ratings, some of which changed over time. States also differed in the number of TQRIS components they used, the ways they defined these components, and how they used these components to rate programs, even for the highest rating level.
- States used various sources of evidence to collect the information needed to rate programs, and they developed processes and standards to ensure the reliability of this information. States typically verified self-reported information from programs with information from another source, such as document reviews or on-site classroom observations. They also required training for the staff who collected information for the ratings.
“Tiered quality rating and improvement systems have flourished under Race to the Top-Early Learning Challenge funds. But, TQRIS take time to develop and implement and differ to reflect state priorities for quality improvement,” says Gretchen Kirby, a senior researcher at Mathematica and lead author of the report. “All the states can learn lessons about TQRIS implementation from the experiences of these nine.”
Follow-up work will focus on the last two areas by examining whether programs participating in TQRIS attained top rating levels and whether ratings convey meaningful differences in program quality.
Read the brief and a related infographic on the study.